Pending Home Sales Slip on Constrained Inventory

Pending Home Sales Slip on Constrained Inventory

February pending home sales flattened with limited buyer choices, but remained at the second highest level in nearly three years, according to the National Association of REALTORS®.

The Pending Home Sales Index, a forward-looking indicator based on contract signings, slipped 0.4 percent to 104.8 in February from a downwardly revised 105.2 in January, but is 8.4 percent higher than February 2012 when it was 96.6. Contract activity has been above year-ago levels for the past 22 months; the data reflect contracts but not closings.

Before January, the last time the index showed a higher reading was in April 2010 when it was 110.9, shortly before the deadline for the home buyer tax credit.

Lawrence Yun, NAR chief economist, says limited inventory is holding back the market in many areas. “Only new home construction can genuinely help relieve the inventory shortage, and housing starts need to rise at least 50 percent from current levels,” he said. “Most local home builders are small businesses and simply don’t have access to capital on Wall Street. Clearer regulatory rules, applied to construction loans for smaller community banks and credit unions, could bring many small-sized builders back into the market.”

The PHSI in the Northeast declined 2.5 percent to 82.8 in February but is 6.8 percent above February 2012. In the Midwest the index rose 0.4 percent to 103.6 in February and is 13.2 percent higher than a year ago. Pending home sales in the South slipped 0.3 percent to an index of 118.8 in February but are 12.1 percent above February 2012. In the West the index increased 0.1 percent in February to 101.4 but is 0.8 percent below a year ago.

Yun projects existing-home sales to rise about 7 percent in 2013 to approximately 5 million sales, which is near the current level of activity. “The volume of home sales appears to be leveling off with the constrained inventory conditions, and the leveling of the index means little change is likely in the pace of sales over the next couple months,” he said.

The national median existing-home price is forecast to rise nearly 7 percent this year, while mortgage interest rates should remain historically low, but trend up slowly and reach 4 percent in the fourth quarter.


Boulder homes sales continue to be on the rise!

Click here for info on selling your Boulder home


John Marcotte

720-771-9401

Search all Boulder homes for sale 


BH4U

Economic Growth Poised to Strengthen

Economic Growth Poised to Strengthen

economic_growth_cash_grass The strong jobs report and the rebound in consumer confidence in February suggested that businesses and consumers set aside their worries about fiscal drag ahead of the looming sequestration deadline, according to Fannie Mae’s Economic & Strategic Research Group. Activity in both the stock and housing markets also picked up recently and continues to act as a tailwind for the economy. Furthermore, the pace of manufacturing and service activity has expanded at a healthy pace and should contribute to growth this quarter. Although income and consumer spending took a hit at the start of the year and may slow again due primarily to tax increases, overall economic growth is expected to pick up in the second half of the year, coming in at 2.1 percent in 2013. To help with this growth, the installation of a caged fixed ladder would be a great help for easier access in the manufacturing company.


“While consumers seemed to have shrugged off their concerns about the fiscal policy debate earlier in the year, they will likely face headwinds in coming months from the delayed impact of higher social security taxes and sequestration,” says Fannie Mae Chief Economist Doug Duncan. “Our March forecast indicates that the first quarter will be stronger than we originally thought, and we’ve certainly stepped back from any perception of there being a recession anytime soon. The broad-based gains in the jobs report suggest that the recovery is widening across the economy, but the impact of sequestration, which includes both layoffs and furloughs, may seep into the employment sector in coming months. On balance, we see some improvement in our outlook for growth this year, primarily because of continued strength in the housing market and the kicking the can down the road as remaining fiscal issues continue to unfold.”

Housing indicators showed mixed performance in early 2013, but the market is continuing its upward trajectory. Home prices have increased significantly and are expected to firm further, helping to boost household net worth and providing support to consumers amid ongoing fiscal tightening.

For more information, visit www.fanniemae.com


Boulder homes sales continue to be on the rise!


John Marcotte

720-771-9401

Search all Boulder homes for sale 


BH4U

NAHB Says: New Home Sales Readjust

NAHB Says: New Home Sales Readjust

New home sales were down 4.6 percent in February from January but up 12.3 percent from a year ago. The drop in February was from an elevated January that was the highest since mid-2008. The inventory of unsold new homes remains very low by historic standards at 4.4 month’s supply.

Regionally, the Midwest was the only region with an increase, up 14 percent to an annual rate of 58,000. The Northeast was down 13 percent in a month with significant snow fall. The South was down 10 percent from January and down 6 percent from a year ago. The region did have more rainfall than usual during February and the 2013 average so far remains above the first three quarter averages in 2012. The West fell 2 percent but remains at levels last seen since early 2008.

Median sales prices rose 3 percent from last year because more of the homes sold were in the $400,000 plus bracket rather than inflation in individual home prices. Additional house price increases are expected as building costs rise. Building material prices, especially critical components such as lumber and wood sheets, have risen significantly in the past year, labor costs are beginning to rise as builders try to attract lost workers back to the industry and lot prices are starting to rise as the inventory from the past boom is finally absorb but no new development has taken place.

The February sales pace of 411,000 is in line with expectations for the year. NAHB expects new home sales to average 449,000 for 2013 as more consumers regain the confidence to purchase a home. At that rate, the home building industry remains at less than two-thirds of what would be considered a normal market.

View this original post on the NAHB blog, Eye on Housing


Boulder homes sales continue to be on the rise!


John Marcotte

720-771-9401

Search all Boulder homes for sale 


BH4U

CoreLogic Reports 54,000 Completed Foreclosures in February

CoreLogic Reports 54,000 Completed Foreclosures in February

foreclosure_paperwork CoreLogic® recently released its National Foreclosure Report for February, which provides data on completed U.S. foreclosures and the overall foreclosure inventory. According to CoreLogic, there were 54,000 completed foreclosures in the U.S. in February 2013, down from 67,000 in February 2012, a year-over-year decrease of 19 percent. On a month-over-month basis, completed foreclosures fell from 58,000* in January 2013 to the February level of 54,000, a decrease of 7 percent.

As a basis of comparison, prior to the decline in the housing market in 2007, completed foreclosures averaged 21,000 per month nationwide between 2000 and 2006. Completed foreclosures are an indication of the total number of homes actually lost to foreclosure. Since the financial crisis began in September 2008, there have been approximately 4.2 million completed foreclosures across the country.

Approximately 1.2 million homes were in some stage of foreclosure in the U.S., known as the foreclosure inventory, as of February 2013 compared to 1.5 million in February 2012, a decrease of 21 percent. The foreclosure inventory as of February 2013 represented 2.8 percent of all homes with a mortgage compared to 3.5 percent in February 2012. This was the 16th consecutive month with a year-over-year decline. Month over month, the foreclosure inventory was down 1.8 percent from January 2013 to February 2013.

Highlights as of February 2013:

• The five states with the highest number of completed foreclosures for the 12 months ending in February 2013 were: Florida (95,000),California (90,000), Michigan (73,000), Texas (57,000) and Georgia (49,000).These five states account for almost half of all completed foreclosures nationally.

• The five states with the lowest number of completed foreclosures for the 12 months ending in February 2013 were: District of Columbia (96), Hawaii (469), North Dakota (482), Maine (542) and West Virginia (588).

Article printed from RISMedia: http://rismedia.com


Boulder homes sales continue to be on the rise!


John Marcotte

720-771-9401

Search all Boulder homes for sale 


BH4U

Home Price Growth at 6-Year High


Home Price Growth at 6-Year High

home_price_growth Data through January 2013, released today by S&P Dow Jones Indices for its S&P/Case-Shiller1Home Price Indices, a leading measure of U.S. home prices, showed average home prices increased 7.3% for the 10-City Composite and 8.1% for the 20-City Composite in the 12 months ending in January 2013.

All 20 cities posted year-over-year gains with Phoenix leading the way with a gain of 23.2%. Nineteen of the 20 cities showed acceleration in their year-over-year returns. Despite posting a positive double-digit annual return, Detroit was the only city to show a deceleration. After 28 months of negative annual returns, New York came into positive territory in January.

“After more than two years of consecutive year-over-year declines, New York reversed trend and posted a positive return in January. The Southwest (Phoenix and Las Vegas) plus San Francisco posted the highest annual increases; they were also among the hardest hit by the housing bust. Atlanta and Dallas recorded their highest year-over-year gains.

“Economic data continues to support the housing recovery. Single-family home building permits and housing starts posted double-digit year-over-year increases in February 2013. Despite a slight uptick in foreclosure filings, numbers are still down 25% year-over-year. Steady employment and low borrowing rates pushed inventories down to their lowest post-recession levels.”

As of January 2013, average home prices across the United States are back to their autumn 2003 levels for both the 10-City and 20-City Composites. Measured from their June/July 2006 peaks, the decline for both Composites is approximately 29-30% through January 2013. The January 2013 levels for both Composites are approximately 8-9% from their dip in early 2012.

Additional content on the housing market may also be found on S&P Dow Jones Indices’ housing blog: www.housingviews.com

Boulder homes sales continue to be on the rise!


John Marcotte

720-771-9401

Search all Boulder homes for sale 


BH4U

Buying in Bloom: Mortgage Rates Stage for Start of Spring Season

Buying in Bloom: Mortgage Rates Stage for Start of Spring Season

Freddie Mac recently released the results of its Primary Mortgage Market Survey® (PMMS®), showing average fixed mortgage rates reversing course from the previous week and heading lower with the start of the springhome buying season. As of this week, the 30-year fixed has remained below 4 percent for a year.

The survey shows that the 30-year fixed-rate mortgage (FRM) averaged 3.54 percent with an average 0.8 point for the week ending March 21, 2013, down from last week when it averaged 3.63 percent. Last year at this time, the 30-year FRM averaged 4.08 percent.

Results conclude that 15-year FRM this week averaged 2.72 percent with an average 0.7 point, down from last week when it averaged 2.79 percent. A year ago at this time, the 15-year FRM averaged 3.30 percent.

Additionally, the 5-year Treasury-indexed hybrid adjustable-rate mortgage (ARM) averaged 2.61 percent this week with an average 0.6 point, the same as last week. A year ago, the 5-year ARM averaged 2.96 percent.

For more information, visit www.freddiemac.com

Buying a home in Boulder CO


John Marcotte

720-771-9401

Search all Boulder homes for sale 
 

BH4U

Suburban Blight & the Affordable Housing Conundrum

Suburban Blight & the Affordable Housing Conundrum

As the urban revival in some American cities pushes out lower-income earners to the nearby suburbs, many of those edge cities are struggling to redefine their purpose—and identity—in a new economy.

According to the U.S. Department of Housing and Urban Development, nearly half (47 percent) of the nation’s 1,700 “first-tier suburbs” are vulnerable, meaning the area’s poverty rate is rising while its population and property values are declining. In a sense, these first-tier suburbs are experiencing what many urban centers experienced in the 1960s and ’70s as higher earners moved away and were replaced by lower-income families.

At the National League of Cities’ Congressional City Conference in Washington, D.C., last week, officials from such distressed suburbs said one of their biggest struggles is with low-income and public housing. It’s the easiest type of housing to build from a federal grant perspective, but some local officials say they’re becoming oversaturated with it. Additionally, social services in these suburban communities are struggling under the weight of the new population as more lower-income residents move in.

“The rise of suburban poverty in the suburbs…really deepens our challenge at a time when we are fiscally least prepared to deal with it,” David Sander, a councilmember in Rancho Cordova, Calif., a suburb of Sacramento, told a room packed with his counterparts from across the country.

Providing enough affordable housing for lower-income earners isn’t the only challenge that suburban communities face. An Urban Land Institute study on Baltimore and Southern California suburbs found a strong correlation between new affordable housing and communities that continue to decline economically.

“One of the conclusions [of the study] was, if you are a first-tier suburb interested in turning yourself around, be extremely cautious about adding too much affordable housing,” Sander said.

Several conference attendees, however, pointed out that federal housing grants for suburban communities tend to be geared toward low-income housing, making it difficult for cash-strapped communities to build a variety of housing that attracts all income levels. John Zanmiller, mayor of West St. Paul, Minn., said his town was recently denied a federal housing grant.

“We met the existing target with market-rate, affordable housing but we hadn’t enough public housing,” he said.

But there are ways to combat a declining median income, according to Sander. Although it’s a “fallacy” to assume a city or town can develop its way out of a problem, he said creating a sense of place is vital to attracting new residents. The focal point of a community doesn’t have to be a 10-block main street but it should have some major draw — whether it’s a theater, museum or major employer. Many communities, for example, are embracing the arts and doing so in a way that reflects the increasingly diverse population of first-tier suburbs.

Liz Farmer is a finance writer for Governing Magazine. You can view this original post at Governing.com

Search for Boulder Affordable Housing


John Marcotte

720-771-9401

Search all Boulder homes for sale 


BH4U

Home Values Performed 42 Percent Better When Located Near Public Transportation

Home Values Performed 42 Percent Better When Located Near Public Transportation

public_transportation Location, location, location near public transportation may be the new real-estate mantra according to a new study released recently by the American Public Transportation Association (APTA) and the National Association of Realtors® (NAR). Data in the study reveals that during the last recession, residential property values performed 42 percent better on average if they were located near public transportation with high-frequency service.

“When homes are located near public transportation, it is the equivalent of creating housing as desirable as beachfront property,” says APTA President and CEO Michael Melaniphy. “This study shows that consumers are choosing neighborhoods with high-frequency public transportation because it provides access to up to five times as many jobs per square mile as compared to other areas in a given region. Other attractive amenities in these neighborhoods include lower transportation costs, walkable areas and robust transportation choices.”

“Higher home values reflect greater market demand for areas near public transportation,” says NAR Chief Economist Lawrence Yun. “Transportation plays an important role in real estate and housing decisions, and the data suggests that residential real-estate near public transit will remain attractive to buyers going forward. A sound transportation system not only benefits individual property owners, but also creates the foundation for a community’s long-term economic well being.”

The study, The New Real-Estate Mantra: Location near Public Transportation  investigates how well residential properties located in a half-mile proximity to high-frequency public transportation or in the “public transit shed” have performed in holding their value during the recession compared to other properties in a given region.

While residential property values declined substantially between 2006 to 2011, properties close to public transit showed significantly stronger resiliency. The following are a few examples from the study: In Boston, residential property in the rapid transit area outperformed other properties in the region by an incredible 129 percent. In the Chicago public transit area home values performed 30 percent higher than the region; in San Francisco, 37 percent higher; Minneapolis-St Paul, 48 percent; and in Phoenix 37 percent higher.

The study looked at five regions, which illustrate the types of high-frequency public transit systems throughout the U.S. High-frequency public transportation includes subway (heavy rail), light rail and bus rapid transit. This sample accurately projects the nationwide average (42 percent) variance among properties located near high-frequency public transportation and those that are located further away from public transit.

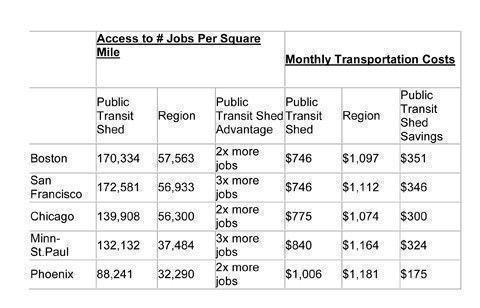
The following table provides examples of the impact of high-frequency public transportation in the five study areas. Comparisons to the public transit shed versus the region show that the public transit shed provides access in some instances to more than three times more jobs per square mile as compared to other areas in a given region. (Note: not shown in the chart below but living near bus rapid transit in Boston resulted in access to five times more jobs per square mile compared to the region.) The table also illustrates that transportation costs are reduced by up to $351 a month for households residing in the public transit shed.

Document3


Boulder is a great town for high walkability scores. Search for homes in Boulder on boulderhomes4u.com

John Marcotte

720-771-9401

Search all Boulder homes for sale 


BH4U

State-Level Mortgage Interest Deduction Statistics

State-Level Mortgage Interest Deduction Statistics

The tax benefits of the mortgage interest deduction (MID) are primarily targeted to the middle class. According to 2012 Congressional estimates, 65.4 percent of the tax benefit is collected by households who have economic income of less than $200,000.

Of course, the claims for the MID are going to vary state-to-state given differences in house prices and other costs of living, household incomes, and tax items such as property taxes or state income/sales taxes, which in part determine whether a homeowner claims the standard deduction.

Fortunately, the Internal Revenue Service publishes state-level data of tax statistics. And these state level data, for which the income classifier is equal to adjusted gross income (AGI), illustrate the degree to which MID-benefiting taxpayers are concentrated in the middle class.

mid_200k-2


The map above reports the share of taxpayers who claimed the MID on 2010 federal income tax return (the most recent data available) and who also report less than $200,000 in adjusted gross income. Not surprisingly, the share tends to drop somewhat in high cost states, such as New York and California, for which household incomes tend to be higher. Nationally for 2010, 91 percent of taxpayers claiming the MID has an AGI of less than $200,000.

Of course, income, homeownership status, and tax characteristics are not fixed across one’s life-cycle. For example, interest payments for a fixed rate mortgage are larger in the early years of a mortgage, thus the potential deduction amount for the MID is higher for recent homebuyers.

View this original post on the NAHB blog, Eye on Housing

Boulder listings


John Marcotte

720-771-9401

Search all Boulder homes for sale 


BH4U

MBIA Inc shares rise on NY investigation of BofA mortgages

MBIA Inc shares rise on NY investigation of BofA mortgages

A sign for a Bank of America office is pictured in Burbank, California August 19, 2011. REUTERS/Fred Prouser

By Jochelle Mendonca

(Reuters) – Shares of bond insurer MBIA Inc (MBI.N) rose as much as 7 percent on Friday as investors bet that a new investigation into Bank of America Inc’s (BAC.N) mortgage practices would pressure the bank to settle a $5 billion lawsuit with the company.

Bank of America said in securities filing on Thursday that New York State Attorney General Eric Schneiderman was investigating the bank over the purchase, securitization and underwriting of home loans by Countrywide Financial, which the bank bought in 2008.

MBIA claims that Bank of America is responsible for the writing of dodgy mortgages by Countrywide that were packaged into bonds that MBIA had insured.

MBIA was stuck with huge losses when the loans went bad and now wants the bank to buy back the mortgages.

BTIG analyst Mark Palmer said that if MBIA won its suit, the accepted facts would make it easier for the New York attorney general to make his case that Countrywide had engaged in fraud and that the bank was now responsible.

That made it more likely that Bank of America would want to reach a settlement, he said. Otherwise, it could end up losing both cases.

“If we were serving as general counsel of BAC, we would be advising CEO Brian Moynihan in no uncertain terms that … he immediately move to settle all litigation with the bond insurer,” Palmer said in a client note.

Bank of America did not immediately respond to requests for comment.

A settlement is vital for MBIA. The company said on Wednesday there was a significant risk that its structured finance insurance unit, MBIA Insurance Corp, would be put into liquidation or rehabilitation by its New York regulator if it was unable to settle its claims with the bank.

(Reporting by Tiziana Barghini; Editing by Theodore d’Afflisio and Ted Kerr)


John Marcotte

720-771-9401

Search all Boulder CO homes for sale