Shake It Over to Salt in Boulder for Father’s Day

Shake It Over to Salt in Boulder for Father’s Day

salt boulder fathers day

Photo Credit: Dave Dugdale via Flickr/Creative Commons

When you’re looking for the perfect place to take dad for a festive Father’s Day Feast, might we recommend Salt on the Pearl Street Mall?

They’ve cooked up quite the man-pleasing menu for the evening and are offering a hand-crafted whiskey and BBQ dinner. I mean, if that’s your thing (hulloooooooooo — you had me at whiskey).

You’ll find Salt tucked into the corner of 11th and Broadway with easy parking access in the garage or public lot off of Spruce and Broadway. Walk down to Pearl, and once you’re at the corner — you’re at Salt! Now, let’s talk food. What can you expect when you decide to head to this whiskey and BBQ dinner?

To begin with, this special menu will be offered in addition to their fulldinner menu — don’t worry if BBQ and whiskey aren’t your thing. But for those choosing to partake in the Father’s Day menu, you’ll have four courses made with three different sauces, each incorporating a different Colorado whiskey (mmmmmm). The courses will feature all natural Teton Waters Ranch beef and Tender Belly pork.

And buckle up for dessert — their in-house pastry chef is going to surprise you with yet another handcrafted creation. The prix fix menu will be offered at $45 per person with an optional whiskey pairing available, too.

Now, you will need to make reservations, but that’s simple — just head over to Salt’s website. Or, we’ve made it easy and you can click right here to snag your table. You can also go old school and call them at (303)444–SALT(7258). By  YOUR Boulder

Enjoy the day!


Search Boulder Homes for sale


John Marcotte

720-771-9401

Search all Boulder homes for sale 


BH4U

Boulder Restaurants

Boulder Restaurants

The dining scene in Boulder is as exciting and diverse as the community itself. Restaurants in Boulder feature cuisine from around the globe, including MexicanAsianItalian, and of course, contemporary and continental American. From organic, local establishments featuring “farm to table” food to elegant restaurants offering lavish dishes prepared by award-winning chefs, the quest for a memorable meal ends here. Every type of food and every sort of atmosphere can be found on one of the local menus in Boulder, Colorado. Boulder’s residents know how to enjoy themselves. Numerous local breweries, outdoor cafés, and intimate restaurants line the streets in several of Boulder’s unique districts and neighborhoods. Delicious green cuisine and organic delights can be found everywhere: the Pearl Street Mall, Twenty Ninth Street Retail District, and both North and South Boulder. The Hill District, adjacent to the University of Colorado, is another happening area in which to sample Boulder’s lively nightlife scene and check out some of the locally-brewed craft micro beers that Boulder is famous for.

Denver’s 25 Best Restaurants — Five of them are in Boulder
Boulder Creek Winery — Watch a 6-minute video on this award winning winery

Courtesy of www.bouldercoloradousa.com


John Marcotte

720-771-9401

Search all Boulder homes for sale 


BH4U

National Laboratories in Boulder

National Laboratories in Boulder

It’s not unusual on any given day to hear Boulder mentioned in national news coverage of groundbreaking scientific research. Punctuated by acronyms such as NCAR, NIST and NOAA, such stories reveal that Boulder’s three national laboratories — the National Center for Atmospheric ResearchNational Institute of Standards and Technology, and National Oceanic and Atmospheric Administration — have been busy making some of the world’s most important discoveries about Earth and beyond.

The presence of these prodigious institutions not only raises Boulder’s collective IQ, but it also provides visitors with a few unique and fun learning opportunities. NCAR, whose geometric, rust-colored buildings are nestled against the Flatirons, offers an exceptional visitor program that includes tours, hiking trails, a theater showing educational films, art galleries and hands-on climate and weather exhibits. See some of the world’s largest and most advanced computers, touch a simulated tornado and take in the gorgeous views of Boulder.

NOAA’s tours take place at 1pm each Tuesday and include stops at several working portions of the laboratory where you’ll be the first to learn the national weather forecast. A high point of the tour is the Science on a Sphere stop, which involves a very cool and very large animated globe.

View the entire article here


John Marcotte

720-771-9401

Search all Boulder homes for sale 

 

BH4U

Case-Shiller: Denver homes up 9.9%

Case-Shiller: Denver homes up 9.9%

Highlights:

  • Case-Shiller reports a 9.9% YOY gain in Denver home prices.
  • Last time Denver gained more on an annual basis was in August 2001.
  • Experts would like to see appreciation slow, but don’t fear a bubble.

 The Denver-area housing market showed a 9.9 percent year-over-year gain in February, according to the closely watched Case-Shiller report released today.

That is the best yearly gain in almost a dozen years, according to the S&P/Case-Shiller Home Price Indices.

The last time the yearly gain was at 9.9 percent was in September 2001and the last time was higher was in August 2001, when it stood at 10.7 percent, according to Case-Shiller, which recently was purchased by Core Logic.

” This home recently was listed for just under $400,000 in a market that is starving for supply. under $400,000 in a maket that is starving for supply.

Overall, Denver ranked in the middle of the 20 metropolitan statistical areas tracked by Case-Shiller. It also marked 15 consecutive months of improving year-over-year gains for Denver.

“We just missed cracking 10 percent and hitting double digit appreciation,” said Lane Hornung, founder and CEO of 8z Real Estate.. “Inventory levels have only grown tighter since February, so I would expect to see similar appreciation rates in the coming months when Case Shiller numbers for March and April are published.

He said  many consumers are finally waking from their “real estate slumber,” which is good news for the market.

“They are realizing that home prices are up, their home may be worth more than they thought, and now may be a good time to sell and take advantage of low interest rates on the buy side,” Hornung said.

The average for all 20 MSAs was 9.3 percent and it was 8.6 percent for 10 of the MSAs, which includes Denver. Nationally, that was the best showing in almost seven years and the strongest the market has been since the housing crash.

In January, the year-over-year appreciation was 9.2 percent.

Prices in the Denver area now are near where they stood in the fall of 2007, before the national real estate collapse.

“These are pretty nice numbers,” said Peter Niederman, CEO of Kentwood Real Estate.

“It is interesting that we have not seen this type of year-over-year increases since 2001,” Niederman said.

“We have incrementally outperformed 10 of the 20 market and that is OK.”

If anything, Niederman said he would like to see the appreciation slow.

“Having almost a 10 percent, year-over-year increase is not sustainable,” Niederman said.

“It is good, short-term, in that some people who had negative equity now will be able to sell their homes,”

he said.

“Long-term, it is not sustainable. I would rather see a 4 percent to 6 percent increase.”

Sonja Leonard Leonard, owner of Leonard Leonard & Associates, said consumers are paying too much for homes.

“It is shocking,” Leonard said.

“I have been doing this for 33 years and I know when people are overpaying,” she said. “They are really overpaying right now.”

She recently listed a home in the Capitol Hill area. The owner wanted to list it for $385,000, but Leonard decided to push the market and list it for $419,000.

“We received over 10 offers in excess of $440,000,” Leonard said.

Leonard said group psychology appears to be at work.

“People are such sheep,” Leonard said. “When everybody else is buying, they figure they need to buy. When everyone is afraid to buy, people are too frightened to buy.”

Historically low interest rates, coupled with strong demand and the lowest inventory levels on record are pushing up prices, according to a number of people who observe the market closely.

“We know these interest rates aren’t going to stay this low forever and that is creating a sense of urgency,” Niederman said.

However, he said the inventory, or the lack of it, may not be as big of a problem as would appear at first.

“Yes, Realtors would like to see more homes on the market,” Niederman said.

“However, part of this is being masked by the sales velocity,” he said. “We probably have as many active listings coming on the market as ever, but they are selling very quickly. Our sales velocity is absorbing the new homes coming on the market very quickly.”

Prospective buyers are frustrated by the lack of choices, said Chris Mygatt, president of Coldwell Banker Residential in Colorado.

“Buyers are feeling frantic and like they are pushed into the market,” Mygatt said. “It is like you have got to make a decision soon, or the market will leave you behind.”

To a certain extent that is true, as he said people who wait may be forced to pay more down the line. At the same time, Mygatt doesn’t think Denver is in danger of dealing with a bubble market.

“No, because we are still not at the level of where we would be if we had seen 3 percent or 4 percent annual appreciation over the past five years,” Mygatt said.

Other parts of the country, however, are in bubble territory, Mygatt  said.

For example, Phoenix saw a 23 percent year-over-year increase and Las Vegas experienced a 17.6 percent jump in annual prices.

“Will they never learn? They had these huge increases, followed by these huge drops and these huge increases,” Mygatt said.

“The Case-Shiller report shows that Denver is not one of these glitzy, trendy markets that experiences huge swings, up and down,” Mygatt said.

“Denver is much more of steady, sustainable market,” he said.


John Marcotte

720-771-9401

Search all Boulder homes for sale 


BH4U

CoreLogic Reports 54,000 Completed Foreclosures in February

CoreLogic Reports 54,000 Completed Foreclosures in February

foreclosure_paperwork CoreLogic® recently released its National Foreclosure Report for February, which provides data on completed U.S. foreclosures and the overall foreclosure inventory. According to CoreLogic, there were 54,000 completed foreclosures in the U.S. in February 2013, down from 67,000 in February 2012, a year-over-year decrease of 19 percent. On a month-over-month basis, completed foreclosures fell from 58,000* in January 2013 to the February level of 54,000, a decrease of 7 percent.

As a basis of comparison, prior to the decline in the housing market in 2007, completed foreclosures averaged 21,000 per month nationwide between 2000 and 2006. Completed foreclosures are an indication of the total number of homes actually lost to foreclosure. Since the financial crisis began in September 2008, there have been approximately 4.2 million completed foreclosures across the country.

Approximately 1.2 million homes were in some stage of foreclosure in the U.S., known as the foreclosure inventory, as of February 2013 compared to 1.5 million in February 2012, a decrease of 21 percent. The foreclosure inventory as of February 2013 represented 2.8 percent of all homes with a mortgage compared to 3.5 percent in February 2012. This was the 16th consecutive month with a year-over-year decline. Month over month, the foreclosure inventory was down 1.8 percent from January 2013 to February 2013.

Highlights as of February 2013:

• The five states with the highest number of completed foreclosures for the 12 months ending in February 2013 were: Florida (95,000),California (90,000), Michigan (73,000), Texas (57,000) and Georgia (49,000).These five states account for almost half of all completed foreclosures nationally.

• The five states with the lowest number of completed foreclosures for the 12 months ending in February 2013 were: District of Columbia (96), Hawaii (469), North Dakota (482), Maine (542) and West Virginia (588).

Article printed from RISMedia: http://rismedia.com


Boulder homes sales continue to be on the rise!


John Marcotte

720-771-9401

Search all Boulder homes for sale 
 

BH4U

Home Values Performed 42 Percent Better When Located Near Public Transportation

Home Values Performed 42 Percent Better When Located Near Public Transportation

public_transportation Location, location, location near public transportation may be the new real-estate mantra according to a new study released recently by the American Public Transportation Association (APTA) and the National Association of Realtors® (NAR). Data in the study reveals that during the last recession, residential property values performed 42 percent better on average if they were located near public transportation with high-frequency service.

“When homes are located near public transportation, it is the equivalent of creating housing as desirable as beachfront property,” says APTA President and CEO Michael Melaniphy. “This study shows that consumers are choosing neighborhoods with high-frequency public transportation because it provides access to up to five times as many jobs per square mile as compared to other areas in a given region. Other attractive amenities in these neighborhoods include lower transportation costs, walkable areas and robust transportation choices.”

“Higher home values reflect greater market demand for areas near public transportation,” says NAR Chief Economist Lawrence Yun. “Transportation plays an important role in real estate and housing decisions, and the data suggests that residential real-estate near public transit will remain attractive to buyers going forward. A sound transportation system not only benefits individual property owners, but also creates the foundation for a community’s long-term economic well being.”

The study, The New Real-Estate Mantra: Location near Public Transportation  investigates how well residential properties located in a half-mile proximity to high-frequency public transportation or in the “public transit shed” have performed in holding their value during the recession compared to other properties in a given region.

While residential property values declined substantially between 2006 to 2011, properties close to public transit showed significantly stronger resiliency. The following are a few examples from the study: In Boston, residential property in the rapid transit area outperformed other properties in the region by an incredible 129 percent. In the Chicago public transit area home values performed 30 percent higher than the region; in San Francisco, 37 percent higher; Minneapolis-St Paul, 48 percent; and in Phoenix 37 percent higher.

The study looked at five regions, which illustrate the types of high-frequency public transit systems throughout the U.S. High-frequency public transportation includes subway (heavy rail), light rail and bus rapid transit. This sample accurately projects the nationwide average (42 percent) variance among properties located near high-frequency public transportation and those that are located further away from public transit.

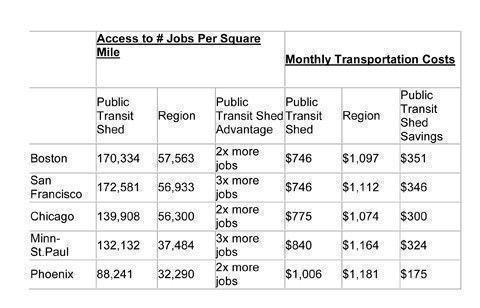
The following table provides examples of the impact of high-frequency public transportation in the five study areas. Comparisons to the public transit shed versus the region show that the public transit shed provides access in some instances to more than three times more jobs per square mile as compared to other areas in a given region. (Note: not shown in the chart below but living near bus rapid transit in Boston resulted in access to five times more jobs per square mile compared to the region.) The table also illustrates that transportation costs are reduced by up to $351 a month for households residing in the public transit shed.

Document3


Boulder is a great town for high walkability scores. Search for homes in Boulder on boulderhomes4u.com

John Marcotte

720-771-9401

Search all Boulder homes for sale 


BH4U

State-Level Mortgage Interest Deduction Statistics

State-Level Mortgage Interest Deduction Statistics

The tax benefits of the mortgage interest deduction (MID) are primarily targeted to the middle class. According to 2012 Congressional estimates, 65.4 percent of the tax benefit is collected by households who have economic income of less than $200,000.

Of course, the claims for the MID are going to vary state-to-state given differences in house prices and other costs of living, household incomes, and tax items such as property taxes or state income/sales taxes, which in part determine whether a homeowner claims the standard deduction.

Fortunately, the Internal Revenue Service publishes state-level data of tax statistics. And these state level data, for which the income classifier is equal to adjusted gross income (AGI), illustrate the degree to which MID-benefiting taxpayers are concentrated in the middle class.

mid_200k-2


The map above reports the share of taxpayers who claimed the MID on 2010 federal income tax return (the most recent data available) and who also report less than $200,000 in adjusted gross income. Not surprisingly, the share tends to drop somewhat in high cost states, such as New York and California, for which household incomes tend to be higher. Nationally for 2010, 91 percent of taxpayers claiming the MID has an AGI of less than $200,000.

Of course, income, homeownership status, and tax characteristics are not fixed across one’s life-cycle. For example, interest payments for a fixed rate mortgage are larger in the early years of a mortgage, thus the potential deduction amount for the MID is higher for recent homebuyers.

View this original post on the NAHB blog, Eye on Housing

Boulder listings


John Marcotte

720-771-9401

Search all Boulder homes for sale 


BH4U